Pre-contact subsistence farmers in the four corners region of the US had a population that flourished and then died out on the same time course as East Asian dynasties, an extreme example of income not determining fertility.
Figure 40 is the survival experience of a community of native American farmers in the American Southwest in a place called Long House Valley.
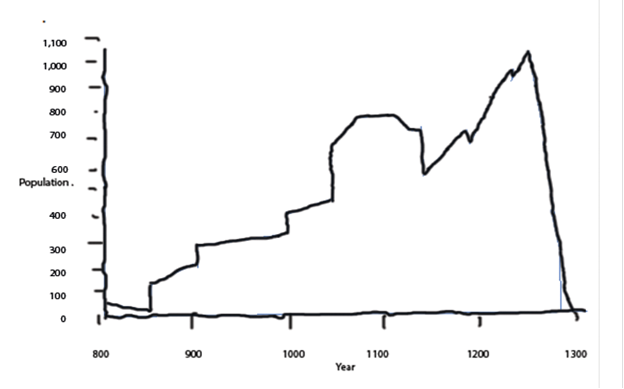
The survival experience of a community of native American farmers in the American Southwest in a place called Long House Valley. The horizontal axis is the date in years. The vertical axis is the population reckoned from number of cook fires in a year.
Fig. 40 21
Around the turn of the century, a man named Jared Diamond put together an idea, sufficient resources and capable people and turned the attention of this mighty assemblage to a bit of vacant land call Long House Valley in the Four Corners region of the American Southwest. Nobody lives in Long House Valley, much less makes a living by farming. But this was not always true; for some centuries and before any contact with Europeans, a number of Anasazi natives did do just that. I have seen it presented as absolute fact that the reason Europeans came to dominate the natives in the Western Hemisphere was because of superior agricultural technique. Go ahead. Try farming in Long House Valley.
Diamond’s excellent work here deserves close study.
Diamond’s question was how many people did that valley support. Clearly, that would be a different number at different times. In pursuit of the question, his team identified every cook fire in every house or ruins thereof in the entire valley during the entire period of occupation. They subjected every lump of charcoal to carbon fourteen dating, and came up with what years that hearth was used. Adding the fireplaces with their uses, he was able to propose an annual census for the valley. I find this most impressive. I don’t think I could have worked out all the details myself. Then he and his team went on to locate a lot of wood that had grown during the same period. Close inspection of the wood showed tree ring thicknesses, which varied rather smoothly from year to year. Both the population census and the tree ring thickness went up and down and up and down again. Of course, this produces the population notch you see. Diamond used a computer to give the best match.
The match is so good that it seems inescapable that there is a causal connection. Either the tree rings are causing the population to change, the population is causing changes in the tree rings or they are both the result of some other factor. Diamond went for number three: the tree rings reflect rainfall, and rainfall limits the number of people the valley can sustain. Since number one (some strange effect of wood on human fertility) is not viable, number three seems reasonable, but it is not perfect.
Starting in the year 800, some people move in; their numbers decline. If the people come from a traditional community, that community was probably in good balance, the size being about right for zero growth as predicted by the Sibly curve. Since only about 50 people seem to have come, that would be a very few families, and they may be dealing with inbreeding depression. From 850 to 1050 there are four more occasions of people moving in. Clearly, this is a culture where people move in groups of families. But there is a screech of warning. If tree rings reflect rainfall and rainfall limits population, these people are moving into an environment that cannot sustain that. Besides being a foolish move, and these clearly were no fools, their indiscretion should be reflected in a drop in numbers that we do not see. All the while the tree rings indicate more and more growth. Very convenient to have the climate change and rainfall increase to sustain human growth, but hardly plausible.
Around 1100 the tree rings suggest, if we buy into the rainfall theory, that the valley could support more people, but the population does not keep up. Instead it falls behind and the falls absolutely. When fertility recovers and then the population starts to grow for the final time, the tree rings lead the way. In the final plunge, population falls faster then tree ring thickness for a while, which for once would be consistent the rainfall governing population size but then the tree rings begin to stabilize but the population does not. In short, the people are somehow cultivating the woods in anticipation of the amount of wood they will need.
Climate change is much on people’s minds nowadays, so it is quite understandable that it came to Diamond’s mind as a way to explain the correlation. But a closer look, in all due respect, does not support it. Furthermore, although we can clearly see times when people moved in – population size increasing faster than natural increase could accomplish – we never see unequivocal departures. They could have “moved away,” but had they done so we should see one or more occasions of stepwise population fall.
So, I regard the rainfall theory as being an illusion. We have a population that is freely rising and falling because of its own factors. We dismiss the rainfall theory from further discussion.
Diamond’s team did work that gave them a number of houses that were occupied in any one year, from which they calculated a population of varying size. Obviously, this is a more direct measure that simply looking at how likely a dynasty is to fail and inferring a lack of capable people. We are not surprised, given the better resolution, to see that the notch in the population curve is a good deal deeper than the notches in the dynasty curves.
Diamond asked a good question and put together a large amount of relevant data. What happens to a population if you just cut it loose and let it run? Evidence suggests that these people move in groups, and after the 1050 migration there is no unequivocal instance of any migration. War, famine and plague should show a stepwise decrease indistinguishable from an exodus if numbers were significantly affected.
From the migration of the year 1000 to the end when the valley fell empty would be 300 years. It appears that these subsistence farmers on marginal land had the same population time course and the same profile – notch and all – as the course and profile of dynasties that ruled all of Asia. It’s all mating pool size and kinship. Accident of status means nothing. Actually, there is the question of folic acid we have yet to describe, and of course cheap cloning of humans might potentially change much in the future. But our evidence comes from the past. Glancing back over the population course, notice that of the two population peaks, the second is higher than the first. We have observed damped oscillation of population in cyberspace, in the lab and in the wild. In the absence of a handy phrase meaning the opposite of damped oscillation – oscillation with increasing amplitude – might I be so bold as to propose “desiccated oscillation.”? Maybe I’ll go with “strengthening oscillation.” Strengthening oscillation requires power but no problem; this is all happening through metabolism.
Just to get used to the idea a bit, suppose you hear a clank. Maybe the neighbor dropped something. A series of clank’s? If you never heard it before, you are probably curious. But a series of clanks getting louder and louder; expect something to break. Or imagine an ordinary leaf on an ordinary tree. If it is calm, the leaf does not move. A gentle breeze may make it move an inch or so in a cyclic fashion. A stronger wind may shake the whole branch, and the amplitude of the leaf’s oscillation may now be a foot or more. Raise the wind pressure to gale and then hurricane force and the amplitude goes up unless the branch breaks. Bring it up to tornado levels and the tree falls. You cannot have strengthening oscillation indefinitely in any finite system.
Unmindful of such an argument, I put Diamond’s graph on an easel at the front door and meditated on it daily. In my mind, a voice said, “You can never claim to understand something until you can make one.” It seemed a tall order then. It might seem impossible now.
Both subsistence farmers and Asian potentates are shaken by strengthening oscillation. It seems to be the same process. Can the numbers be reconciled? We know that the three-hundred-year brick wall is manifested is several lands. But can we reconcile the dates? Let’s see. China seems to be the cleanest example of the process. I’ll take the liberty of ending the Chinese experience at 300 years like everybody else. That puts them in line with Japan; their notches already match. The drawing of Diamond’s result is not quite accurate, so don’t try to verify it with what follows. If you are interest in ground truth, look at his original paper.
The Chinese experience thus ends at age 300. The farmers die out in year 1300. It’s just another impossible, meaningless coincidence; don’t let it distract you. A man in his forties is in his prime, quite capable of arising at dawn to do back breaking work in the fields the whole day long; a woman has many more years, but generally she is less robust and in the Long House Valley environment at a disadvantage. We assume that the year when the last cook fire went out in Long House Valley was the year the last man was fifty to seventy-five years old.
By contrast, the Asian emperor doesn’t even have to reach for his shoes. There is a eunuch there to do it for him. But if he is the last of his line, there are not that many he can rely on. He must have his wits and his sword about him at all times. A maximum age of fifty to seventy-five seems reasonable.
If the last fire of the famers died in 1300, we would assume that the last male child was born in 1225 to 1250. If the last emperor of a dynasty died when the dynasty was 300 years old, he was born when the dynasty was 225 to 250 years old.
The population in Long House Valley reaches its highest peak, presumably the year the last baby was born – after which there is only inexorable decline – in about the year 1250, which is within the expected range. If the last emperor died when his dynasty was 300 years old, he should have been born when it was 225 to 250 years old, and indeed the top of the second peak is at 250 years old, which is close enough, remembering that we are dealing with 50-year intervals.
The notch in Chinese survival occurs at about age 150 to 200 or 100 to 150 years before the end. The farmers’ notch bottoms out in the year 1150, about 250 years before the end. So, the match all around is better than we could have reasonably asked for.
If we look back from the end of Chinese dynasties 300 years, of course we get to the foundation of the dynasties. If we look back 300 years from the extinction of the farmers – year 1300 – 300 years to the year 1000, we do see one of the episodes of immigration with a stepwise increase in the number of cookfires, greater than could occur by natural increase. Invoking warm, if not overheated, imagination we could claim that prior to that year, growth was gradual reflecting a wholesome balance between inbreeding depression and outbreeding depression. But at that moment, inbreeding depression is eliminated by the new arrivals and the outbreeding depression has not yet set in. You remember this takes generations, something like 300 years to work its way through a population.
After that year, growth starts upward and remains higher until a year shortly before 1100. That gradual growth shows roughly balanced inbreeding depression and outbreeding depression might in fact have reached the balance point of the Sibly curve and stayed there for a long time. But alas for these vigorous farmers, further immigration only produced temporary increased fertility for a time before the end.